Dow Jones 30, Nasdaq 100, Nikkei 225 Analysis and Charts
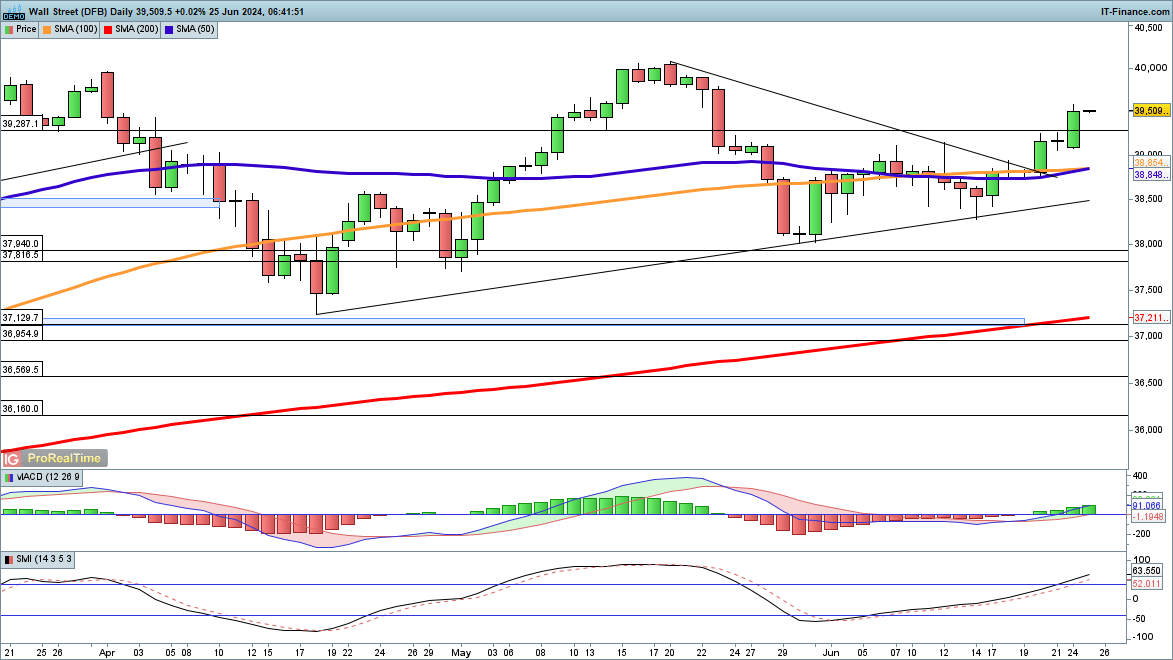
Dow Jones at one-month high
The index continues its strong performance, hitting its highest monthly level on Monday.The 40,000 highs from April and May now loom large, and a close above these will take the price to new record highs. The price established a higher low at the end of May, maintaining the bullish view.
Sellers will need a close back below 38,850 to negate this view in the short term.
Dow Jones Daily Chart
| Change in | Longs | Shorts | OI |
| Daily | -18% | 18% | 7% |
| Weekly | -19% | 14% | 4% |
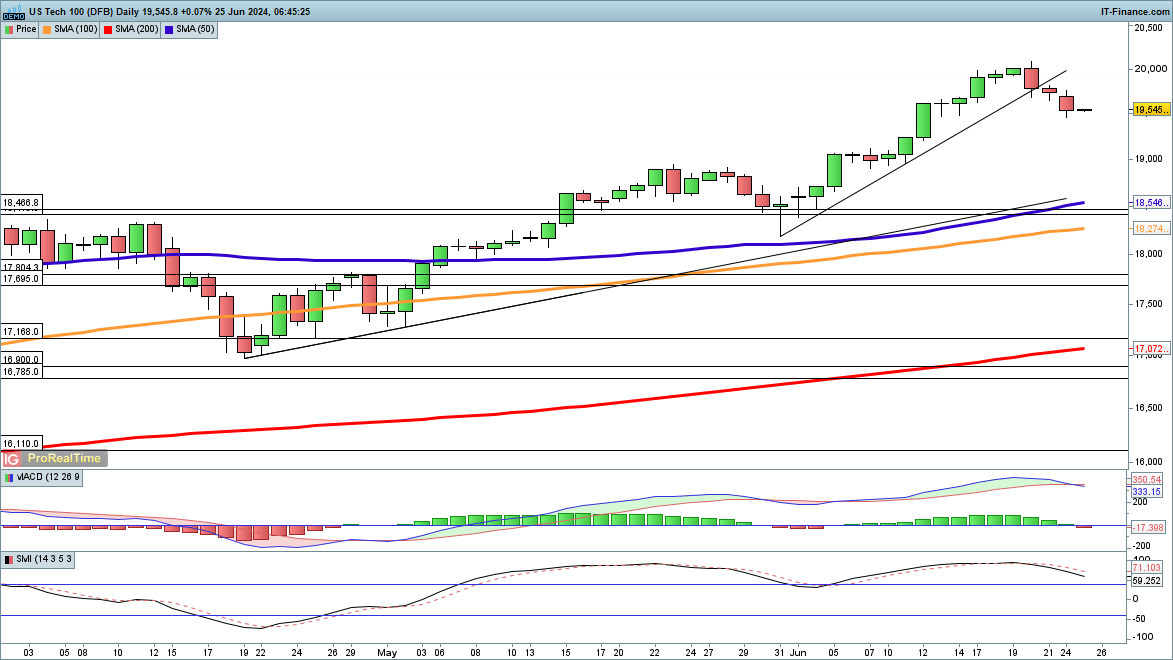
Nasdaq 100 drifts lower
This index continues to edge lower after its early June surge ran out of steam with the move to 20,000. Short-term trendline support from the end of May low was broken on Friday, and modest losses have continued since then. The priceremains firmly in an uptrend but is also around 5% from the rising 50-day simple moving average (SMA). Further short-term declines would take the price toward the late May high at 18,949.
A rebound back above 19,755, Monday’s high, puts the price on an upward course once more.
Nasdaq 100 Daily Chart
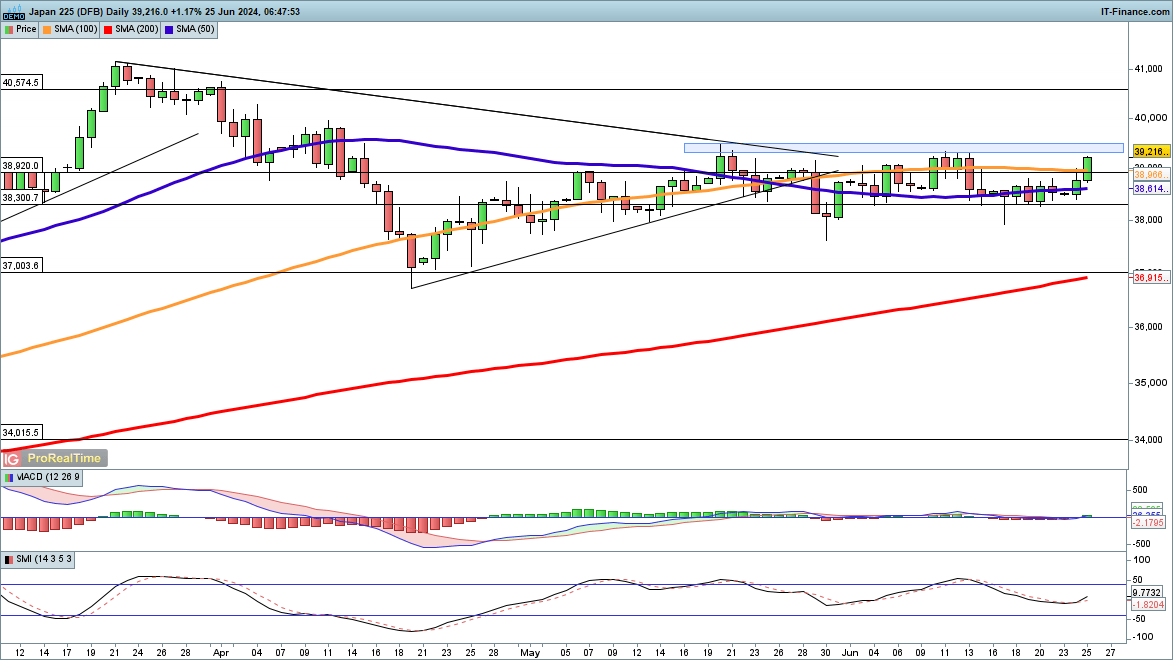
Nikkei 225 makes gains
The price surged overnight on Tuesday, building on Monday’s gains.The first test will be the 39,400, the highs from mid-May, which stalled the last move higher. A close above 39,400 will also put the price above the early June highs. Further gains then target the 40,000 level, followed up by a move towards the March highs.
A reversal back below 38,500 cancels out this view and raises the prospect of another test of support around 38,000.
Nikkei 225 Daily Chart