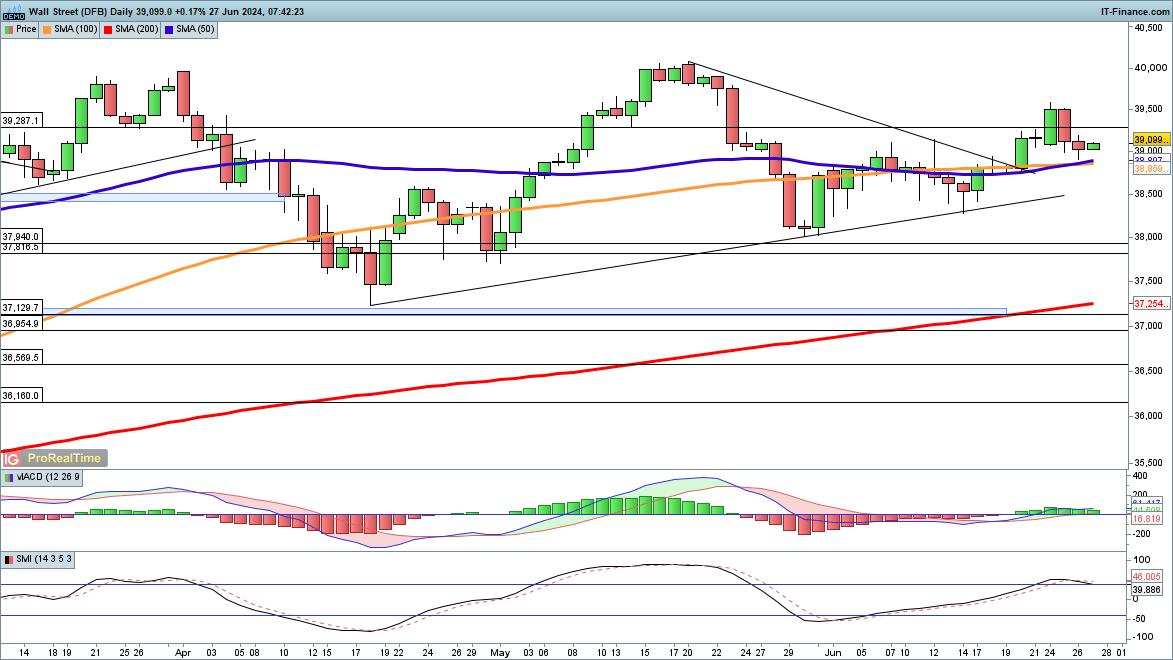
Dow stabilises after fall
The index continued to fall yesterday, after Tuesday’s heavy losses, but buyers entered the fray to lift the index off the lows, and the cash session ended with small gains. Early trading this morning has seen the index move higher, maintaining the bullish view with the price holding above the 50-day and 100-day simple moving averages. This follows on from the breakout above trendline resistance from the May record high.
If the price holds above 39,000 then a push above 39,500 would put the price back on course to 40,000. A more bearish view requires a close back below 38,500.
Dow Jones Daily Chart
| Change in | Longs | Shorts | OI |
| Daily | -18% | 18% | 7% |
| Weekly | -19% | 14% | 4% |
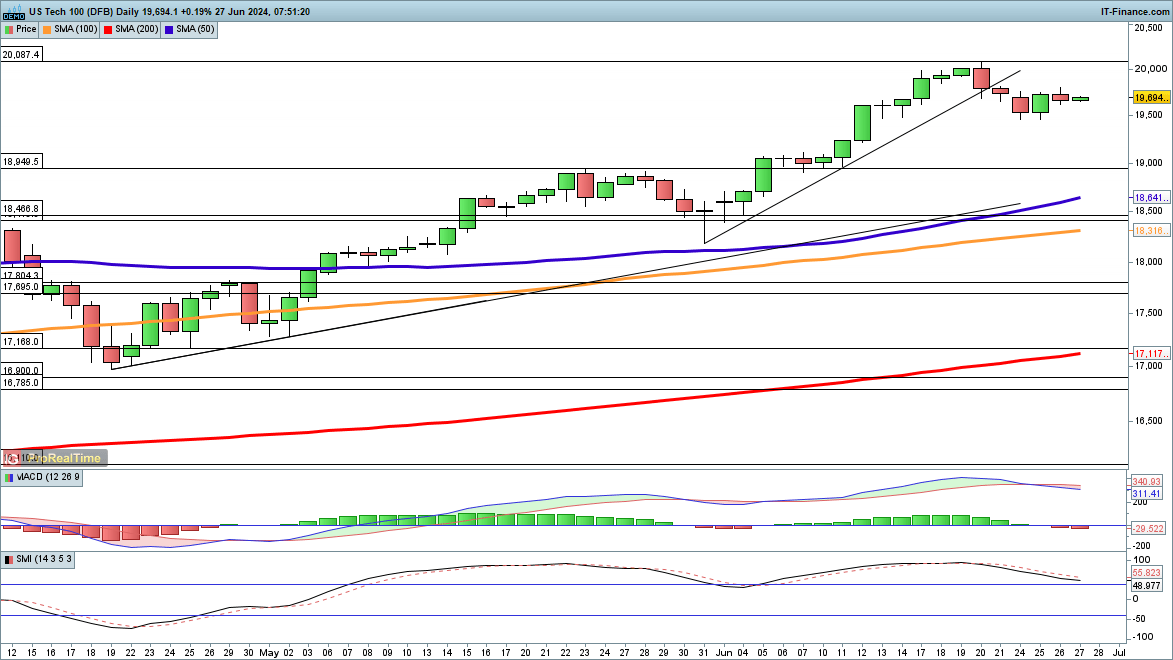
Nasdaq 100 weakness pauses for now
After pulling back at the end of last week and into this week, the index has stabilised, holding above the lows of the week.For now, the potential pullback from the record high has been stopped in its tracks. A close above Wednesday’s high of 19,807 would continue to bolster the short-term bullish view and raise the prospect of a move back to 20,000 and higher.
A reversal and close below 19,500 puts a short-term pullback back in play, perhaps towards the May high at 18,949, or even down to the 50-day SMA, currently 18,640.
Nasdaq100 Daily Chart
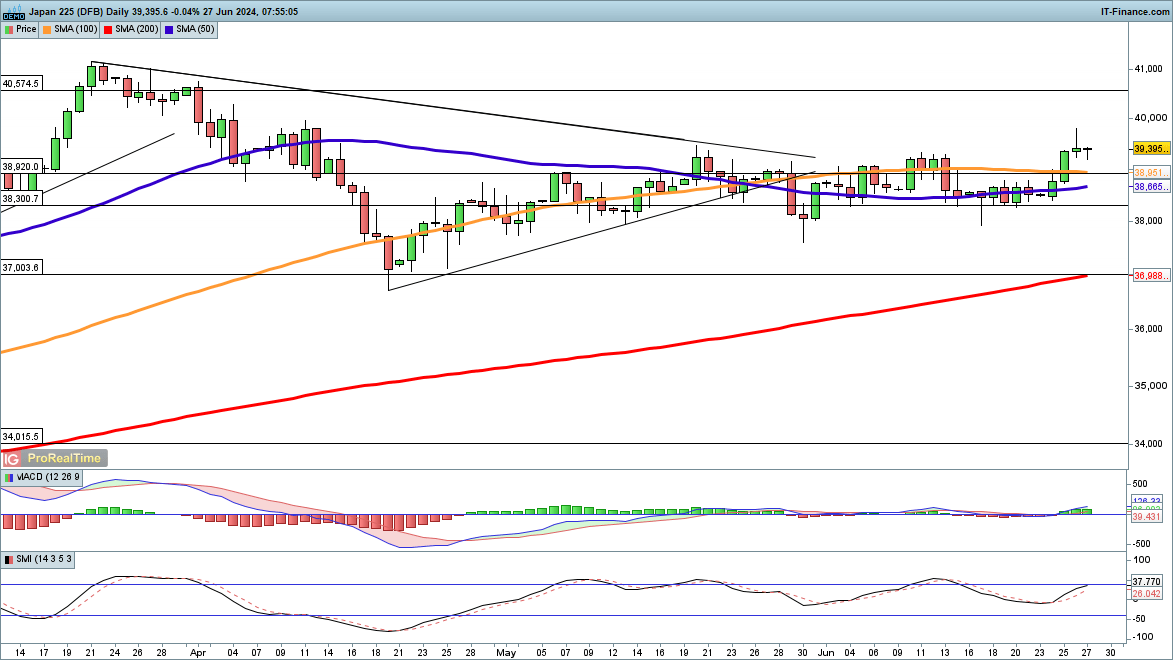
Nikkei 225 on an upward path?
The index has seen a burst of upside momentum over the past week, rallying from the 38,400 zone around which it had hovered during the middle of the month. Gains on Wednesday carried the price to its highest level since 11 April, if only briefly, but while the price could not hold all these gains it did find buyers at the lows overnight. This has carried the price back above 39,300, and a fresh push to close above 39,500 now appears underway.
From here the 11 April high at 39,962 now comes into view. Sellers have surrendered control for the time being, and it would need a close back below 38,950 and the 100-day SMA to negate the bullish view. This might then raise the prospect of a return to the 38,300 area that marked support in late May and June. A close below 38,000 could spark a bigger move to the downside.
Nikkei 225 Daily Chart